

Wyoming cattle producers John and Cindy Robb* in a previous installment looked into how Livestock Risk Protection (LRP) might work to limit at least some of the price risk in their operation.
They decided on a 21-week contract at 96 percent coverage for their 100 head of steer calves weighing 600 pounds. This LRP contract had a total insured value of $77,964 and a premium cost of $2,967.
The main question for the Robbs with this policy is its overall effectiveness. We might ask, “What is the likelihood of an indemnity payment that would cover premium costs?” A partial budget analysis can help answer the question; the Risk Scenario Planning (RSP) tool properly addresses the associated risks.
LRP Overview
LRP is designed for livestock producers (fed and feeder cattle, swine, and lamb) to cover declines in price
Contracts available from 70-100% of expected ending value of cattle
Contract lengths range from 13 to 52 weeks
Indemnities are paid where actual ending values are lower than the coverage value
Values are set by a CME index
Total number of insurable livestock varies by species
Ending value has no bearing on cash price received
RSP Tool Setup
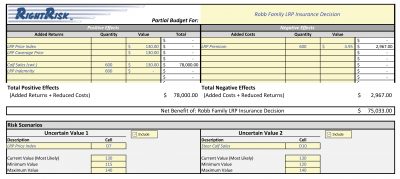
The RSP tool from RightRisk.org helps users evaluate the inherent risk involved in the partial budgeting process. The tool is set up like most partial budgets, with four categories (added returns, reduced costs, added costs, and reduced returns) resulting in estimated net revenue value. Instead of choosing just one value for items that may vary, such as price in this analysis, the tool allows users to examine a range of values (maximum, minimum, and most likely) and the effect on the budget bottom line.
Problems arise when using set values in the budgeting process where they do not account for variability (risk). The RSP tool helps indicate how a range of values (not just a single guess) can affect the budget decision and account for the uncertainty.
Tool Budgets and Analysis
For our example, we input data in two budget categories: added returns and added costs. Under added costs, we enter the LRP premium of $4.945/cwt on 600 cwt ($2,967 total).
We account for a potential indemnity payment under the added returns section. The coverage price is $130/cwt, and we assume the index price in September will be the same ($130/cwt). We enter the indemnity as a function of both the index price and the coverage price (coverage price minus the index price). This will result in a positive indemnity payment only if the index price is lower than the coverage value. Expected actual calf sales and corresponding expected cash price are entered at $130/cwt as well.
The Robbs’ net return would total $75,033 (calf sales of $78,000 minus the LRP premium of $2,967), assuming the expected prices at the end of the contract period and no indemnity payment.
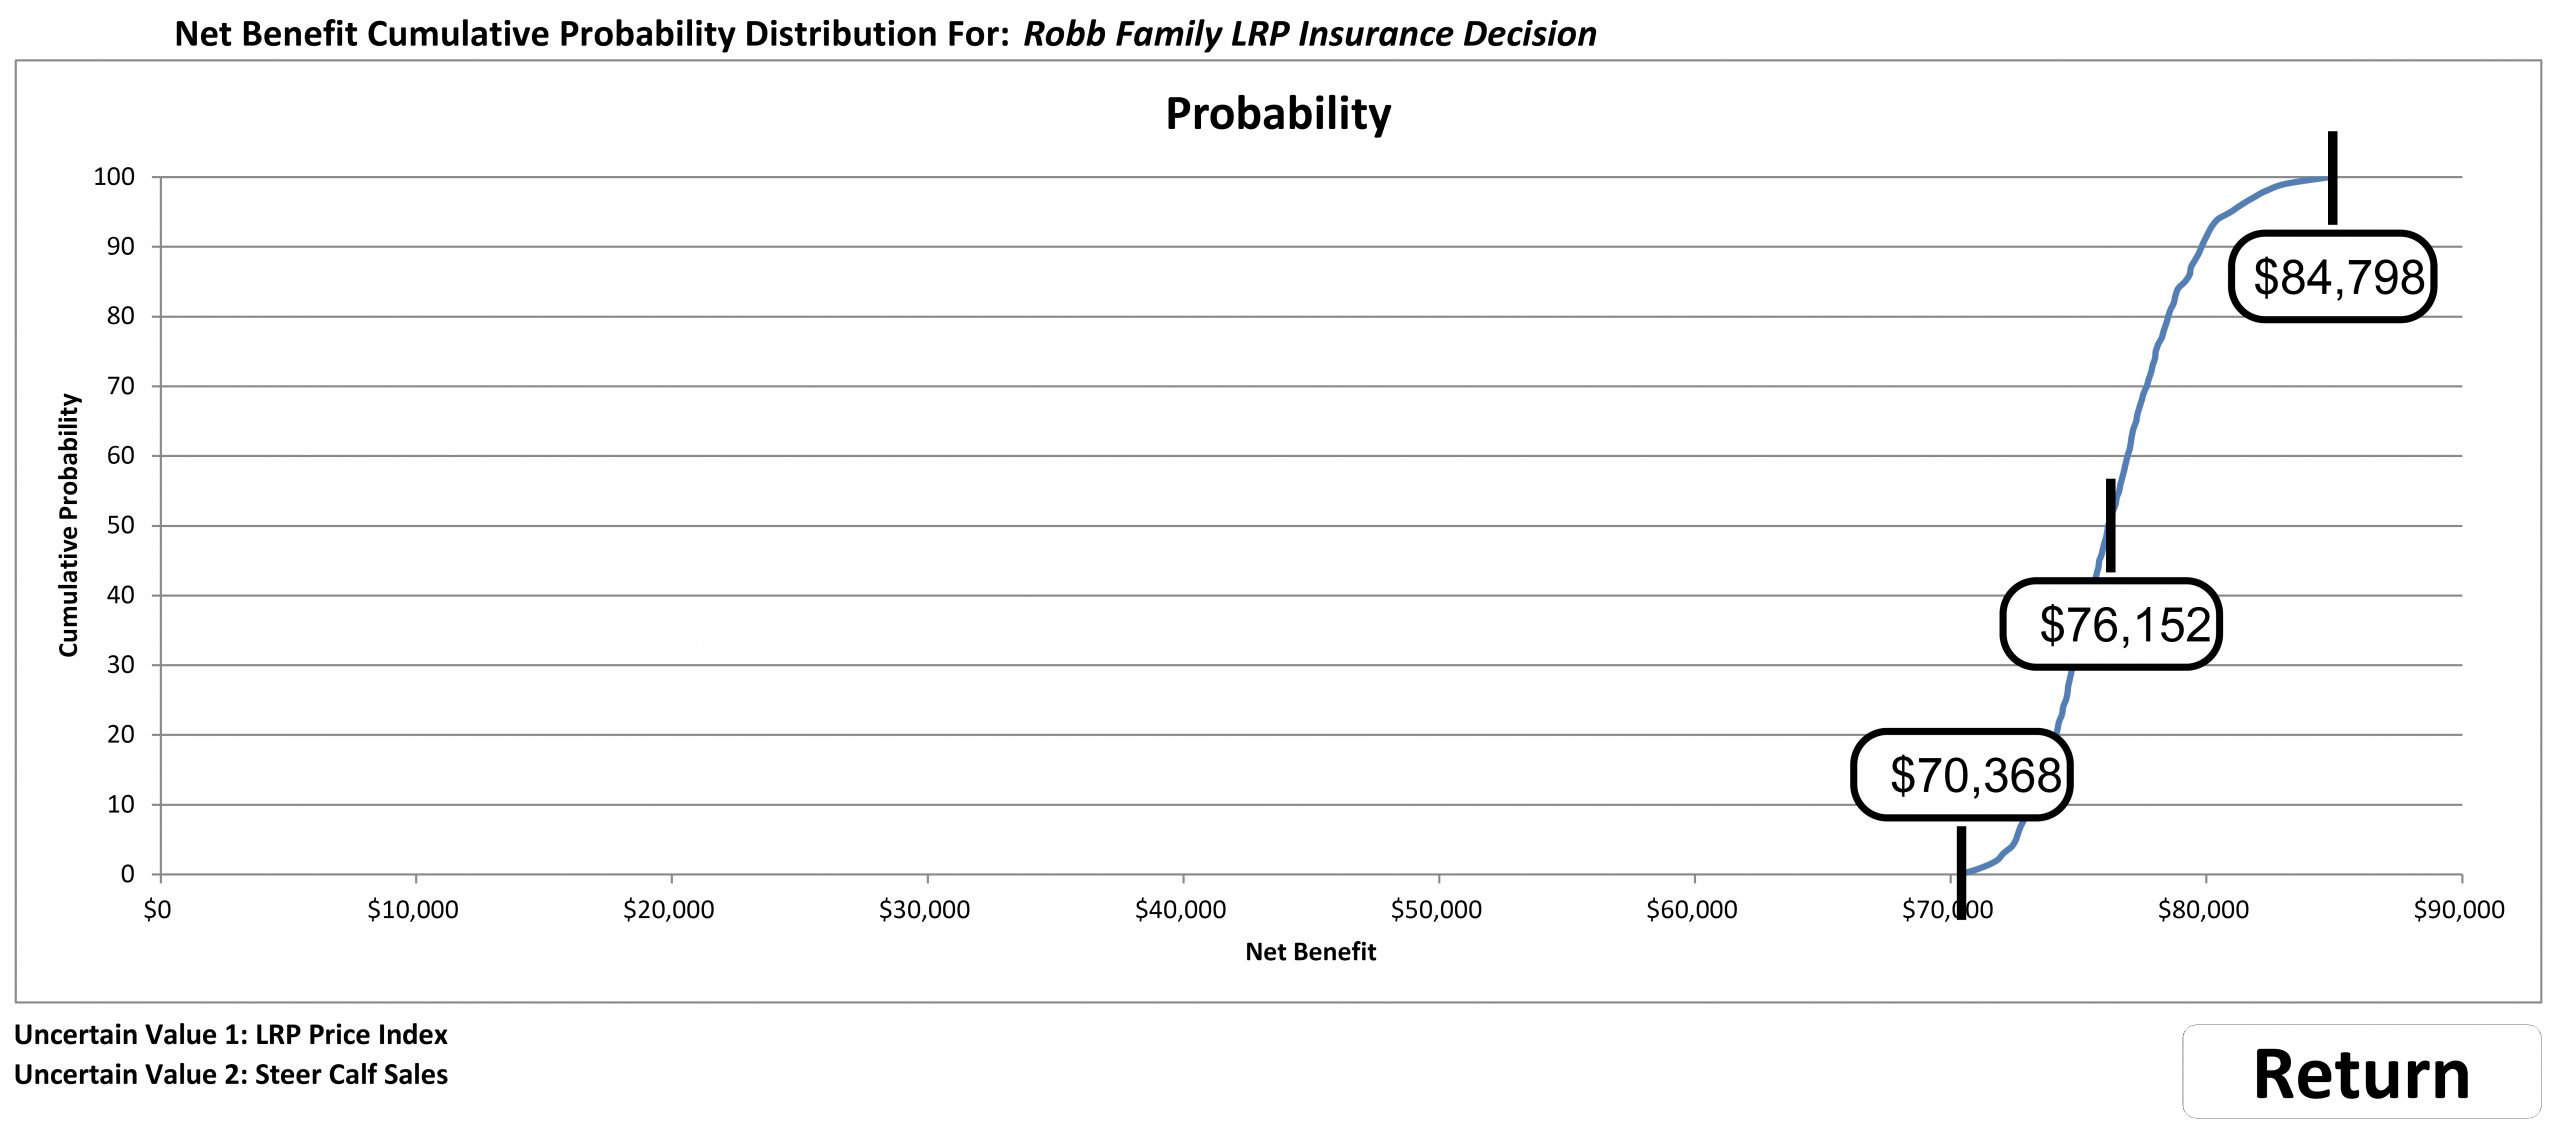
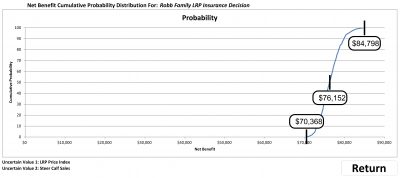
How do we account for uncertainty in the LRP index price and calf sales? This is where the value of the RSP tool comes into play. Suppose the Robbs forecast a maximum value of $140/cwt and a minimum value of $115/cwt for the ending index value. We can also factor in the uncertainty of the price received for steers in September, with a maximum of $140/cwt and a minimum of $120/cwt. Clicking RUN causes the tool to generate a probability distribution, based on the values we entered. The resulting graph describes the range and likelihood of net revenue outcomes, given the various possible combinations of values entered.
The distribution reveals a 50 percent probability of the strategy generating a net return of $76,152 or less, with a maximum possible return of $84,798 and minimum of $70,368. Stated another way, there is a 50 percent probability the net return will be just over a thousand dollars higher with LRP price protection in place, as compared to the expected value without it ($75,033).
*The Robb operation is a case study example created to demonstrate RightRisk tools and their application. No identification with actual persons (living or deceased), places, or agricultural operation is intended nor should be inferred.
James Sedman is a consultant to the Department of Agricultural and Applied Economics in the University of Wyoming College of Agriculture and Natural Resources, and John Hewlett is a farm and ranch management specialist in the department. Hewlett may be reached at (307) 766-2166 or hewlett@uwyo.edu.
For further information
Livestock Risk Protection (LRP) is just one of the many risk management options available to Wyoming producers. Almost all crops and livestock have a policy that can mitigate some of the risk involved with production. Visit rma.usda.gov or a crop insurance agent for more information.
RightRisk Analytics Toolbox
The Analytics Toolbox includes the RSP tool and several other risk analytics tools covering a wide range of agricultural risk management questions and issues, including budgeting, forage leasing, machinery cost, and whole farm budgeting.
To view or download the toolbox – Logon to RightRisk.org and under the Resources Tab, select Risk Management Tools.